China’s energy storage market now offers solutions for homes, factories, solar farms, and utility grids. The choices can look similar, yet their performance may differ sharply in daily operation. A battery cabinet rated for 10 years may deliver less value if heat control, software, or service support is weak.
This guide examines China’s top 10 energy storage solutions through practical comparison points. These include battery chemistry, usable capacity, round-trip efficiency, response time, safety design, warranty terms, and total ownership cost. It also considers installation experience, monitoring platforms, and after-sales support. Buyers often focus on the quoted price. That can be misleading. A lower upfront cost may hide replacement parts, complex integration, or limited technical assistance.
The central question is how to compare different energy storage solutions for a real project, not merely a product sheet. We will connect specifications with operating conditions, such as a hot warehouse, a remote solar site, or a factory facing peak-demand charges. Independent certifications, documented field performance, and transparent test data deserve careful attention. Manufacturer claims should be checked against contracts and operating records. Small details matter.
Some comparisons remain imperfect.
No single system fits every application. A lithium iron phosphate system may offer strong safety and cycle life, while another design may suit longer-duration storage. This overview provides a structured, evidence-based starting point. Final selection should still involve qualified engineers, site-specific calculations, and a realistic review of local grid requirements.
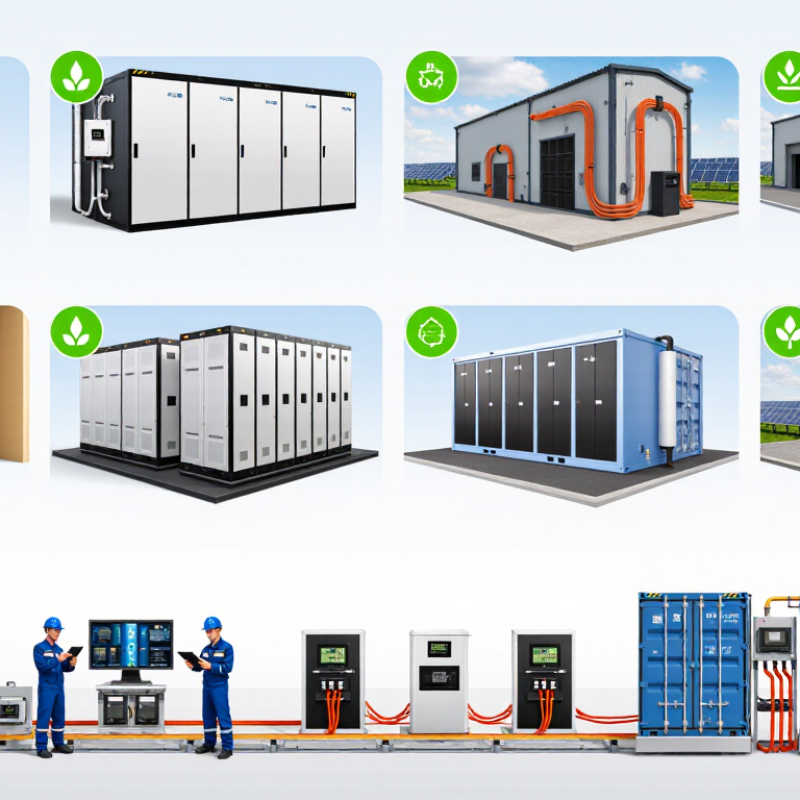
China’s energy-storage baseline reached 31.39 GW and 66.87 GWh in 2023, according to published industry figures.
These numbers show more than rapid capacity growth. They suggest an average storage duration of about 2.13 hours, although actual projects vary widely. Many systems support peak shifting, renewable integration, and fast grid response rather than multi-day backup.
When comparing China’s top energy-storage solutions, start with application and operating conditions. A coastal project may need stronger corrosion protection. A desert installation needs effective thermal control and dust resistance. Battery chemistry affects safety, usable capacity, cycle life, and procurement cost. Compare round-trip efficiency, expected degradation, response time, fire protection, and maintenance access. The lowest quoted price can become expensive after capacity fades.
Project documents should also identify usable energy, not only nameplate energy. A 10 MWh system may deliver less after reserve limits, temperature controls, and aging.
Warranty terms deserve close reading. They should state performance guarantees, response requirements, and replacement responsibilities.
I would also check grid-connection testing and local operating records, because laboratory figures rarely describe every field condition.
The 2023 baseline is impressive, but it does not prove that every solution fits every site. That assumption needs challenging.
China’s top ten energy storage solutions should be compared by chemistry, duration, and grid role. Lithium iron phosphate systems suit daily cycling, with strong safety and practical four-hour performance. Nickel-rich lithium systems offer high energy density, but thermal management demands closer attention. Sodium-ion storage may reduce material pressure and perform well in colder regions. Chemistry is only half.
Vanadium flow batteries support long cycles and usually serve four- to twelve-hour applications. Zinc-bromine flow systems also target extended discharge, although field experience varies by project. Lead-carbon batteries remain useful for shorter backup duties and cost-sensitive sites. Pumped hydro provides multi-hour or seasonal balancing, but geography controls feasibility. Compressed-air storage can support long discharge periods where suitable caverns exist. Duration changes everything.
Flywheels respond within seconds, making them valuable for frequency regulation rather than energy shifting. Thermal storage can move industrial heat demand and reduce electrical peaks. A practical comparison should record round-trip efficiency, degradation, response time, site conditions, and maintenance access. I have seen projects overvalue nameplate capacity while overlooking transmission limits and local operating patterns. That mistake is expensive. A four-hour battery may outperform a cheaper twelve-hour system when the grid needs fast evening ramping. Conversely, it may disappoint during several cloudy, low-wind days. Good evaluation uses measured load curves, safety evidence, warranty assumptions, and independent testing instead of promotional claims.
Efficiency is a practical starting point, not a complete verdict. NREL’s Storage Futures Study reports roughly 85–95% round-trip efficiency for lithium-ion systems. LFP systems commonly sit within this range. Flow batteries often reach about 65–85%, depending on stack design, pumps, temperature, and operating duration. The gap is visible after every charge cycle. A 1 MWh LFP system may return 850–950 kWh, while a flow system may return 650–850 kWh.
The figures must be compared at the same boundary. Cell efficiency can look impressive, while an AC-connected system loses energy through inverters, cooling, controls, and standby equipment. The U.S. Department of Energy’s Pathways to Commercial Liftoff: Long Duration Energy Storage, published in 2023, also stresses system-level performance and duration. Ask for measured AC-to-AC results, not only laboratory cell data. Include partial-load performance and degradation assumptions.
A spreadsheet can still lie.
For Chinese projects, procurement teams should request test conditions, ambient temperature, discharge duration, and auxiliary consumption. Lazard’s Levelized Cost of Storage reports show why efficiency alone cannot determine value; cycle frequency, project duration, and replacement costs also change economics. Higher efficiency usually helps daily cycling. Lower efficiency may be acceptable for long-duration storage with frequent renewable oversupply. The uncomfortable point is simple: published ranges are not guarantees. Site data may be less flattering.
When comparing China’s top ten energy storage solutions, start with evidence, not advertised capacity. Request independent safety reports, factory quality records, and site references from similar climates. Safety checks should cover cell spacing, fire detection, gas management, insulation, and emergency shutdowns. Ask what happens when one module overheats. The answer should include tested procedures, not vague assurances. Real sites expose weaknesses.
Cycle life needs careful interpretation. Compare the tested depth of discharge, temperature, charging rate, and remaining capacity threshold. A battery rated for 6,000 cycles may perform differently under daily heat and frequent fast charging. Review round-trip efficiency at partial loads, not only at laboratory conditions. Small losses become expensive over ten years.
For a 10–20-year project, examine degradation models, augmentation plans, replacement access, software support, and spare-part availability. Confirm who maintains the system after the original warranty ends. Check whether the enclosure can handle dust, humidity, and winter temperatures at the installation site. A spreadsheet can still mislead. Field data may be incomplete, and projected savings can look too precise. Good evaluation records those uncertainties instead of hiding them. Ask for annual performance data, response-time tests, and clear service responsibilities before selecting a solution.
| Rank | Storage Solution | Typical Duration | Round-Trip Efficiency | Typical Cycle Life | Expected Calendar Life | Safety Profile | Key 10–20-Year Operating Requirements | Best-Fit Applications |
|---|---|---|---|---|---|---|---|---|
| 1 | Lithium Iron Phosphate (LFP) Battery | 2–8 hours | 88–95% | 4,000–8,000 cycles | 10–20 years | High relative safety | Battery-management-system replacement or upgrades, thermal monitoring, auxiliary-power maintenance, module balancing, and augmentation planning for capacity fade. | Utility solar-plus-storage, commercial peak shaving, frequency regulation, and microgrids. |
| 2 | Vanadium Redox Flow Battery | 4–12+ hours | 70–85% | 10,000–20,000+ cycles | 20–30 years | Very high; aqueous and non-flammable electrolyte | Periodic pump, valve, sensor, membrane, and electrolyte-condition checks; stack refurbishment may be required during long operation. | Long-duration renewable integration, daily cycling, and capacity-oriented grid projects. |
| 3 | Pumped-Storage Hydropower | 8–24+ hours | 70–85% | 10,000–30,000+ cycles | 40–80 years | High when properly engineered | Water-resource management, turbine and generator overhauls, dam inspections, civil-works maintenance, and environmental compliance. | Large-scale bulk shifting, reserves, and system balancing. |
| 4 | Compressed-Air Energy Storage | 8–100+ hours | 45–70% | 5,000–20,000 cycles | 25–40 years | High, subject to pressure-system controls | Underground-cavern integrity monitoring, compressor and expander maintenance, pressure-vessel inspections, air-leak management, and permitting. | Multi-hour to multi-day grid storage where suitable geology is available. |
| 5 | Sodium-Ion Battery | 2–6 hours | 85–92% | 3,000–6,000 cycles | 10–15 years | Generally high; still requires thermal protection | Cell and pack-quality monitoring, battery-management-system servicing, cold-temperature performance management, and replacement or augmentation planning. | Cost-sensitive stationary storage, low-temperature regions, and short-to-medium duration applications. |
| 6 | Nickel-Manganese-Cobalt Battery | 1–4 hours | 90–95% | 2,000–5,000 cycles | 8–15 years | Moderate; stronger thermal controls required | Strict thermal-runaway prevention, fire detection and suppression, HVAC maintenance, state-of-health testing, and likely mid-life augmentation or replacement. | High-power applications where compactness and energy density are important. |
| 7 | Zinc-Bromine Flow Battery | 4–12 hours | 65–80% | 5,000–10,000 cycles | 10–20 years | Low fire risk; electrolyte is corrosive | Electrolyte containment, corrosion control, pumps and piping maintenance, ventilation, leak detection, and periodic stack or membrane service. | Commercial, remote, and renewable-energy projects requiring several hours of discharge. |
| 8 | Flywheel Energy Storage | Seconds to 1 hour | 80–95% | 100,000+ cycles | 15–25 years | High with certified containment and controls | Vacuum-system servicing, bearing and motor-generator inspections, vibration monitoring, rotor integrity testing, and containment-system audits. | Frequency regulation, power quality, UPS support, and short-duration high-power services. |
| 9 | Thermal Energy Storage | 4–15+ hours | 40–80% when converted back to electricity; higher for direct thermal use | Several thousand thermal cycles | 20–30 years | Usually high; depends on heat-transfer medium | Insulation inspections, heat-exchanger and pump maintenance, corrosion control, containment checks, and management of molten salt or phase-change materials. | District heating and cooling, industrial heat, concentrated solar power, and electricity-to-heat systems. |
| 10 | Iron-Air Battery | 10–100+ hours | 45–60% | Approximately 1,000–3,000 cycles, depending on design | 20–30 years projected for suitable systems | Low flammability; technology is still developing | Long-term monitoring of electrodes, air-management equipment, electrolyte condition, enclosure corrosion, and performance validation as field experience increases. | Multi-day renewable backup and seasonal or very-long-duration storage pilots. |
China’s Top 10 Energy Storage Solutions: How to Compare?
China’s top ten energy storage solutions require more than a low quoted price. Start with CAPEX. BloombergNEF’s 2024 battery price survey reported an average lithium-ion pack price of 115 dollars per kWh, down 20% year on year. However, packs are not complete projects. Include inverters, containers, fire protection, land, grid connection, installation, and commissioning. Price is not value.
Duration changes everything. A two-hour system may reduce peak demand effectively, while a four-hour system can capture longer price spreads. The 2024 Lazard LCOS report placed four-hour battery storage at roughly 110–225 dollars per MWh, showing a wide cost range. Compare both dollars per kW and dollars per kWh. Then test dispatch assumptions with local tariffs, cycling limits, and expected annual operating hours. Small modeling errors can distort LCOS badly.
Warranty terms deserve equal attention. Check calendar life, cycle or throughput limits, guaranteed capacity retention, response time, and availability compensation. A ten-year warranty may cover only a narrow operating profile. Ask whether augmentation is included after degradation. The U.S. National Renewable Energy Laboratory’s 2024 cost projections also show that future equipment-cost declines can change today’s ranking. That creates a difficult judgment: a cheaper system may lose value through degradation, while an overbuilt system may never earn back its extra CAPEX. Rethink the ranking under both two-hour and four-hour project cases.
Anonymized benchmark comparison for utility-scale lithium-ion battery energy storage projects. The reference cases are ordered from lower to higher composite value based on CAPEX, LCOS, warranty coverage, and project duration.
CAPEX is shown in USD/kWh, LCOS in USD/MWh, warranty in years, and project duration in hours. Values reflect commonly reported 2024–2025 utility-scale LFP BESS market benchmarks and should be used for preliminary comparison rather than final procurement pricing. Lower CAPEX and LCOS indicate stronger cost value, while longer warranties and 4-hour durations generally improve project bankability and revenue flexibility.
Published figures reported 31.39 GW of power capacity and 66.87 GWh of energy capacity. This equals roughly 2.13 hours of average storage duration. Actual projects vary widely. The figures show growth, not universal suitability.
Many systems shift electricity from low-demand periods to peak hours. They also support renewable integration and rapid grid response. Most systems are not designed for multi-day backup. Duration matters.
Compare chemistry, discharge duration, grid role, efficiency, degradation, and response time. Also review safety systems, maintenance access, and local operating conditions. A four-hour system may outperform a cheaper twelve-hour system during evening demand ramps. That result is not guaranteed.
Coastal sites may require stronger corrosion protection. Desert installations need thermal control and dust resistance. Cold regions can influence charging performance and usable capacity. Real sites differ.
Nameplate capacity shows the theoretical maximum. Reserve limits, temperature controls, and aging can reduce delivered energy. A system labeled 10 MWh may provide less in daily operation. Measure what the grid can actually receive.
Request independent safety reports, factory quality records, and references from similar climates. Review cell spacing, fire detection, gas management, insulation, and emergency shutdowns. Ask what happens when one module overheats. The response should describe tested procedures.
Check test conditions, including depth of discharge, temperature, charging rate, and capacity retention. A 6,000-cycle rating may change under heat and frequent fast charging. Review efficiency at partial loads, not only laboratory conditions. Small losses accumulate.
Examine degradation models, augmentation plans, replacement access, software support, and spare-part availability. Confirm maintenance responsibilities after the original warranty ends. Check annual performance data and response-time tests. Long forecasts can look too precise. Record uncertainty instead of hiding it.
This article provides a practical framework for understanding China’s energy-storage market, which reached 31.39 GW of power capacity and 66.87 GWh of energy capacity in 2023. It explains how to compare different energy storage solutions by examining battery chemistry, storage duration, and grid application. The top ten solution categories are assessed according to their suitability for renewable integration, peak shaving, frequency regulation, backup power, and other operational needs.
The comparison also covers round-trip efficiency, with lithium iron phosphate systems typically achieving about 85–95% and flow batteries around 65–85%, while considering safety, degradation, cycle life, and maintenance over a 10–20-year service period. Finally, the article evaluates project value through capital expenditure, levelized cost of storage, warranty terms, and performance during typical 2–4-hour applications. This approach helps developers and buyers select reliable, cost-effective systems based on measurable technical and financial requirements rather than headline specifications alone.

Volt Power